Profiling requests with dozer and pympler
Recently, in an effort to find a supposed memory leak, I learned about Dozer, a WSGI middleware to assist in tracking down memory leaks and pympler, a development tool to measure, monitor and analyze the memory behavior of Python objects in a running Python application.
All debugging and profiling are scaffolded in a demo project at: dozer-demo
Scenario
In production we have an app that runs a query against our Influx production cluster and formats it in a required format for our orbit determination needs. We were seeing the docker container restart approximately every 24 hours. The crashed container reported an exit code of 137, usually reported when OOMKiller notices the container using more memory than allocated. The pattern of failures and exit code led us to believe that we had a memory leak.
Setting up for debugging
The app is pretty simple in nature. It uses flask to front an api and has very small number of requirements. The first thing I needed to do is to see what object was being stored in memory. I used the excellent pympler project to get an insight at the python heap.
I created a heapdump endpoint under the debug route to print an instant heap summary, you can try it yourself by running the dozer-demo project locally.
http GET http://localhost:5000/debug/heapdump
HTTP/1.0 200 OK
Connection: close
Content-Type: text/plain; charset=utf-8
Date: Wed, 27 May 2020 02:10:11 GMT
Server: Werkzeug/1.0.1 Python/3.7.7

types |   # objects |   total size
===================== | =========== | ============
                  str |       34116 |      4.26 MB
                 dict |        6652 |      3.20 MB
                 type |        1749 |      1.61 MB
                 code |        9924 |      1.37 MB
                tuple |        7439 |    956.81 KB
                  set |         264 |    303.31 KB
                 list |        2388 |    303.23 KB
   _io.BufferedWriter |           2 |    256.36 KB
              weakref |        2169 |    186.40 KB
   _io.BufferedReader |           2 |    136.36 KB
           re.Pattern |         227 |    120.17 KB
          abc.ABCMeta |         118 |    117.32 KB
   wrapper_descriptor |        1268 |    108.97 KB
    getset_descriptor |        1361 |    106.33 KB
  function (__init__) |         756 |    106.31 KB
Filter for a specific object type:
http GET http://localhost:5000/debug/heapdump filter==bytes
HTTP/1.0 200 OK
Connection: close
Content-Type: text/plain; charset=utf-8
Date: Wed, 27 May 2020 02:11:03 GMT
Server: Werkzeug/1.0.1 Python/3.7.7

types |   # objects |   total size
======= | =========== | ============
  bytes |         403 |     16.22 KB
At a just spawned state everything looked nominal. I ran a few test queries that pulled about 200MB responses each to see how the heap reacted.
NOTE: in dozer-demo this has been replaced by a call to httpbin returning a static json response
http GET http://localhost:5000/json
HTTP/1.0 200 OK
Content-Length: 429
Content-Type: application/json
Date: Wed, 27 May 2020 02:11:31 GMT
Server: Werkzeug/1.0.1 Python/3.7.7

{
    "slideshow": {
        "author": "Yours Truly",
        "date": "date of publication",
        "slides": [
            {
                "title": "Wake up to WonderWidgets!",
                "type": "all"
            },
            {
                "items": [
                    "Why <em>WonderWidgets</em> are great",
                    "Who <em>buys</em> WonderWidgets"
                ],
                "title": "Overview",
                "type": "all"
            }
        ],
        "title": "Sample Slide Show"
    }
}
And now another heapdump, to see bytes usage grow:
http GET http://localhost:5000/debug/heapdump filter==bytes
HTTP/1.0 200 OK
Connection: close
Content-Type: text/plain; charset=utf-8
Date: Wed, 27 May 2020 02:11:59 GMT
Server: Werkzeug/1.0.1 Python/3.7.7

types |   # objects |   total size
======= | =========== | ============
  bytes |         404 |     16.67 KB
The response from httpbin is exactly 429 bytes and doing some quick maths: 16.67 - 16.22 = 0.45 KB you can see the heap grow by approximately the response size. In the production app’s case the growth was a lot larger.
Great! I now know what is being stored in memory but why is the Influx data (or in the demo’s case - json response) sticking around?
Going deeper with dozer
At this point I needed to profile the request to see if I could pinpoint the cause. Using the dozer middleware library I could query my api and profile the call by visiting _profiles page and clicking on a profile:
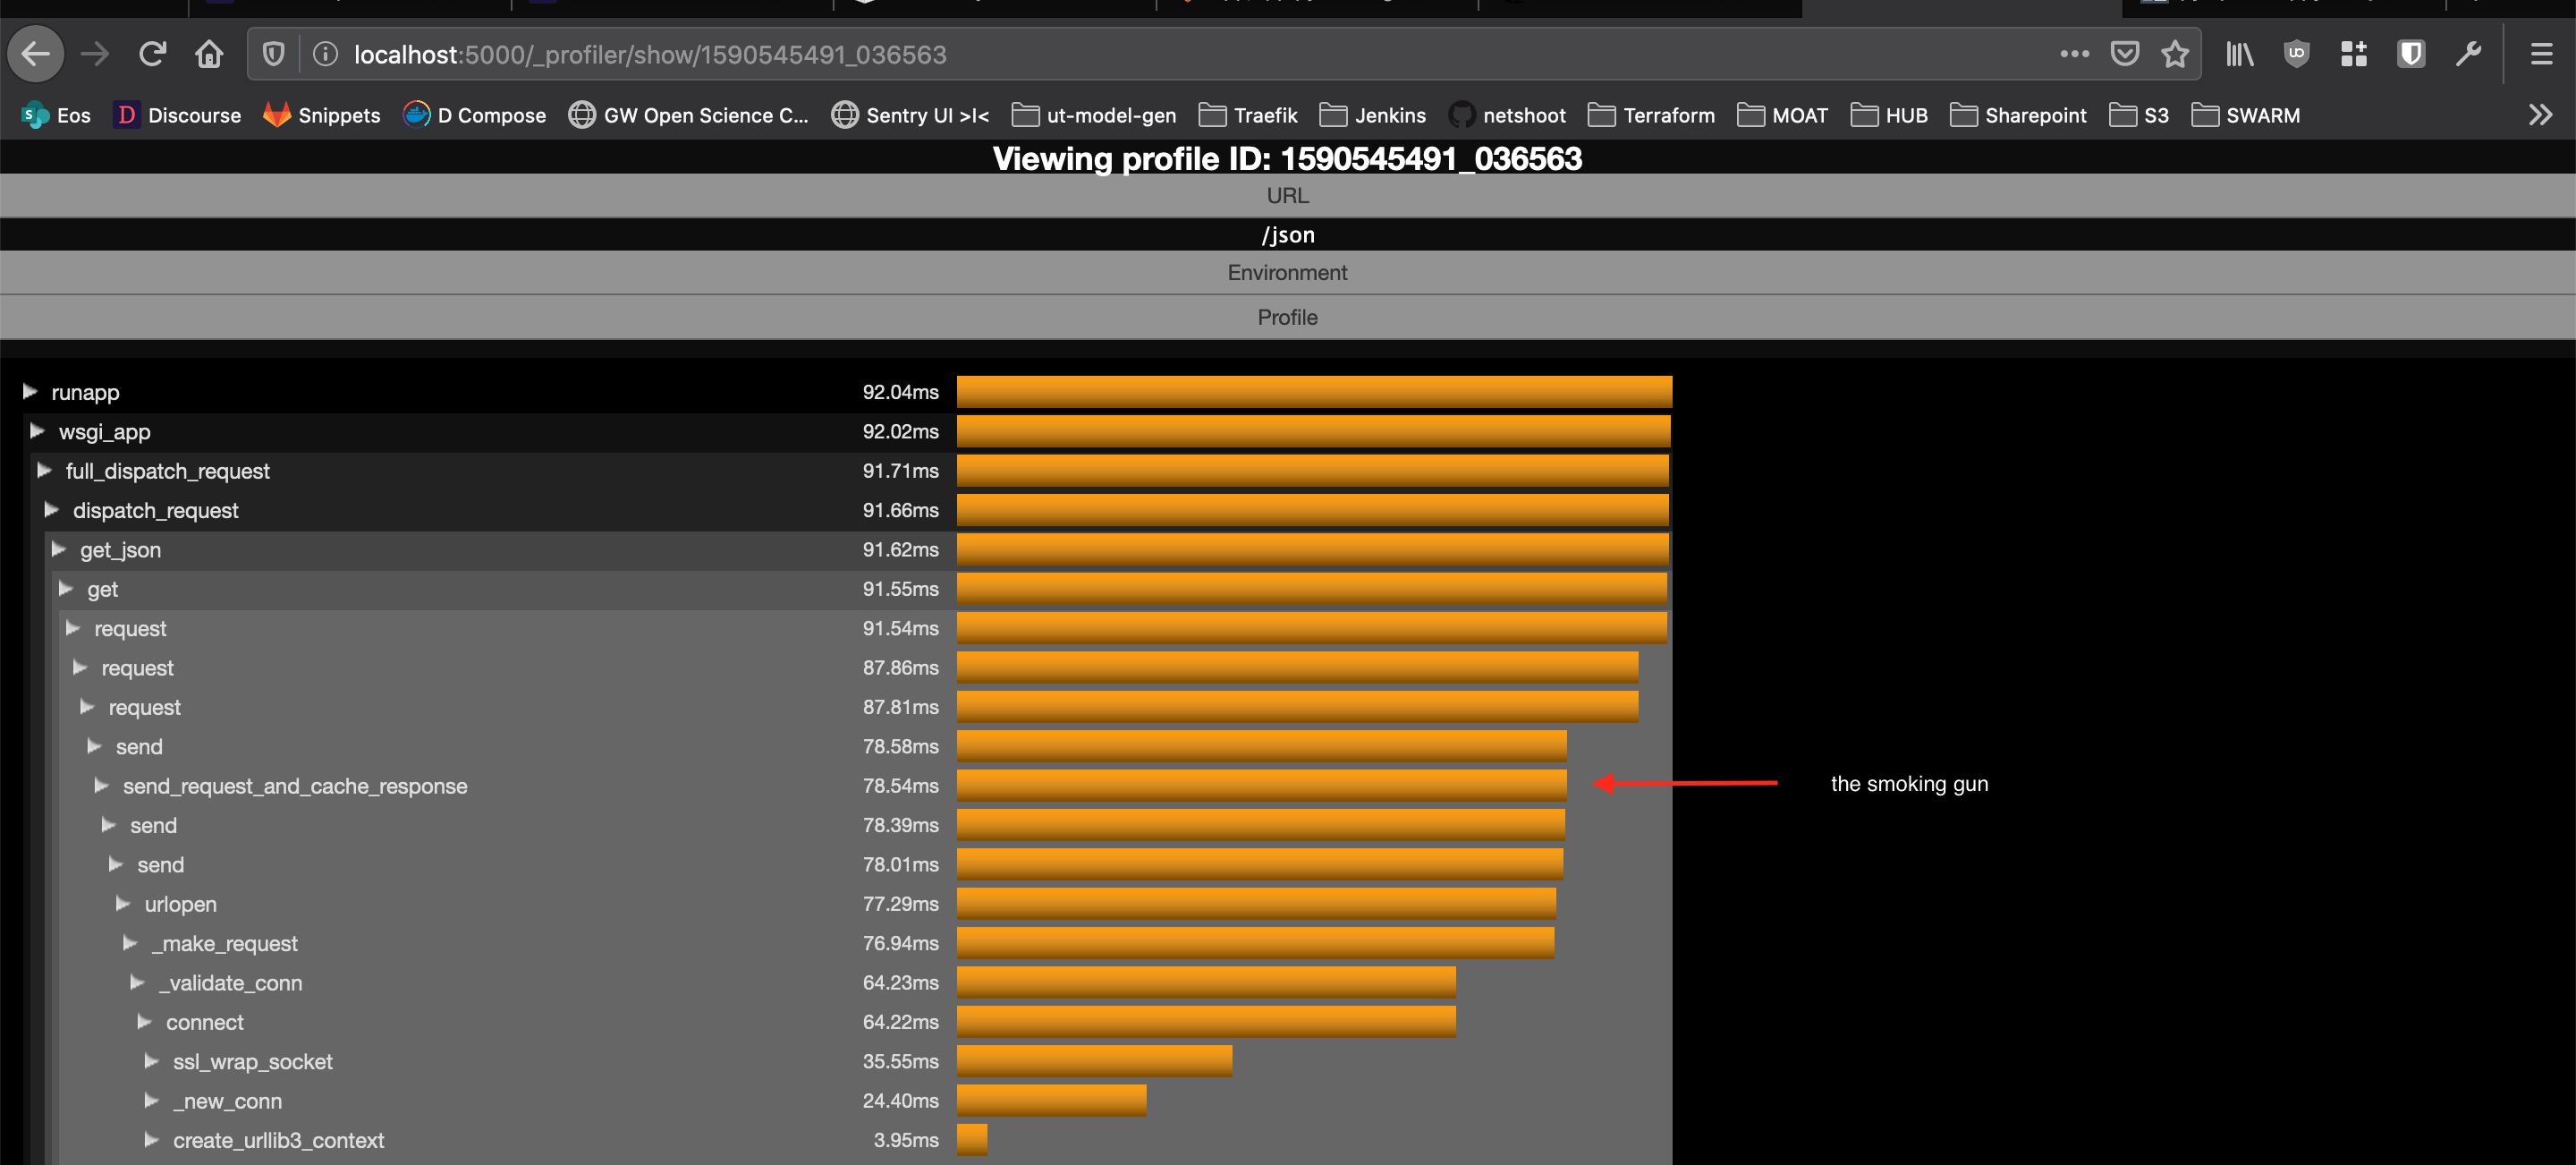
Dozer profile
Root cause
In formatting the influx response we also query a metadata api using requests (that is cached for five minutes) that is used per influx query to enrich the data. The official influxdb-python package is a wrapper that uses the requests library heavily. Using the requests-cache monkeypatches all requests session and caches all responses and headers regardless of query and regardless of size!
Fix
In the end, I ended up removing the requests-cache project completely and implementing a function cache around the metadata api query using cachetools to keep the same functionality without the memory related crashes.
Lessons learned
So yes, this mostly happened because of a lack of reading the ****ing manual but I did get to learn and mess around with two new libraries that I will inevitably use in the future. The dozer-demo is a very simple project aimed at helping others implement there own profiling.